
The HangersPro application on your tablet allows you to view in real time many statistics on your store's activity and revenues.
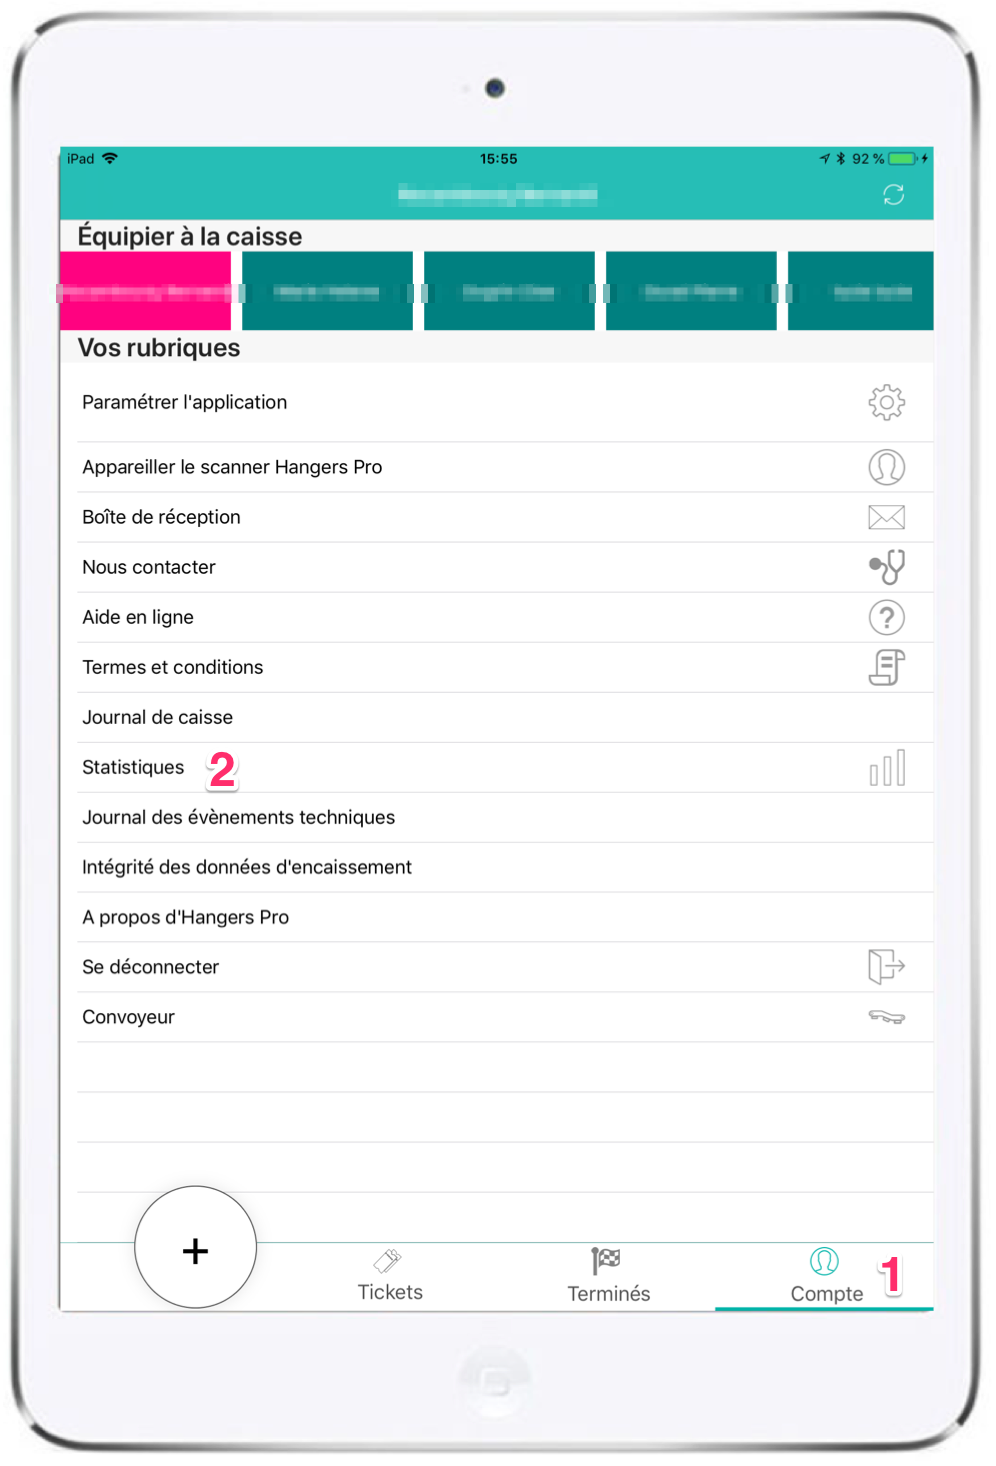
- To view the statistics, in HangersPro on your tablet, click on the "Account" tab (1) located in the lower menu bar and select "Statistics" (2).
Hangers Pro v2.0
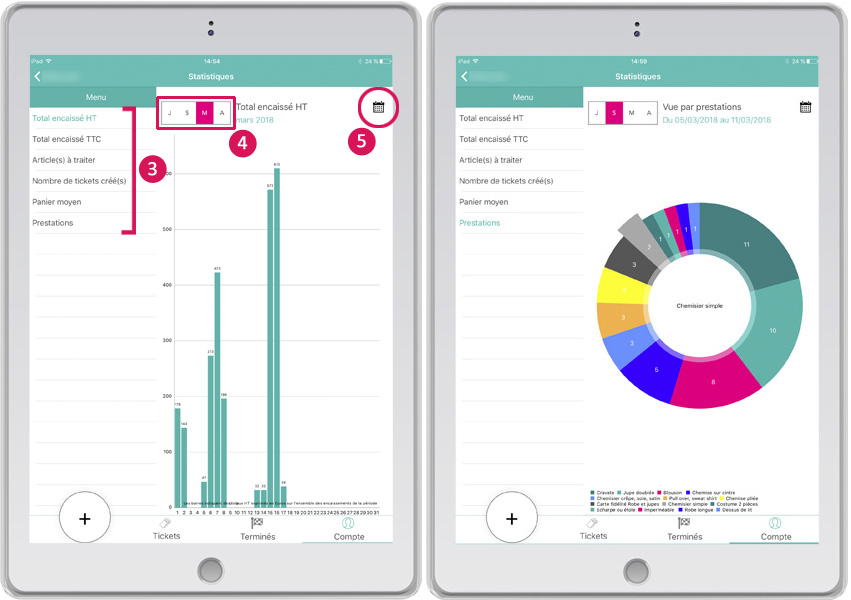
- You are directed to the statistics screen. In the left side menu (3), click on the statistic you want to view:
- the total received (excluding VAT and including VAT),
- the quantity of materials to be processed,
- the number of tickets created,
- the average value of your customers' basket,
- the services provided.
- You can choose to view these statistics in different ways by clicking on one of the J, S, M or A buttons (4) in the upper part of the screen:
- according to the hours of the day (D),
- according to the day of the week (S),
- according to the day of the month (M),
- according to the month of the year (A).
Hangers Pro v2.0
Examples: Total collected excluding VAT per day for the month of March 2018 and services performed during the week of 5 to 11 March 2018
- You also have the option of choosing the period for which you want to view the statistics by clicking on the calendar (5) in the upper right-hand corner of the screen.
Report by cash register or store:
The first two statistics (Total collected excluding VAT and Total collected including VAT) only concern the fund to which your tablet is assigned.
All other statistics are given to you for all the cash registers in your store.
To go further:
You also have the possibility to generate reports from your personal space on https://hangers.io. See the article "Getting statistical reports" for more information.